
Combining technical indicators is the most effective way to filter out false signals on Quotex. Single tools often fail during sudden market shifts.
The Relative Strength Index (RSI) acts as a momentum oscillator. The Moving Average Convergence Divergence (MACD) functions as a trend-following tool. Learning how to use RSI and MACD together on Quotex creates a high-accuracy dual-confirmation system.
This guide explains how to configure, read, and trade using both indicators on Quotex step by step.
Understanding the Fundamentals of RSI and MACD
What is the Relative Strength Index (RSI)?
The RSI measures the speed and velocity of directional price movements. It operates on a bounded scale from 0 to 100.
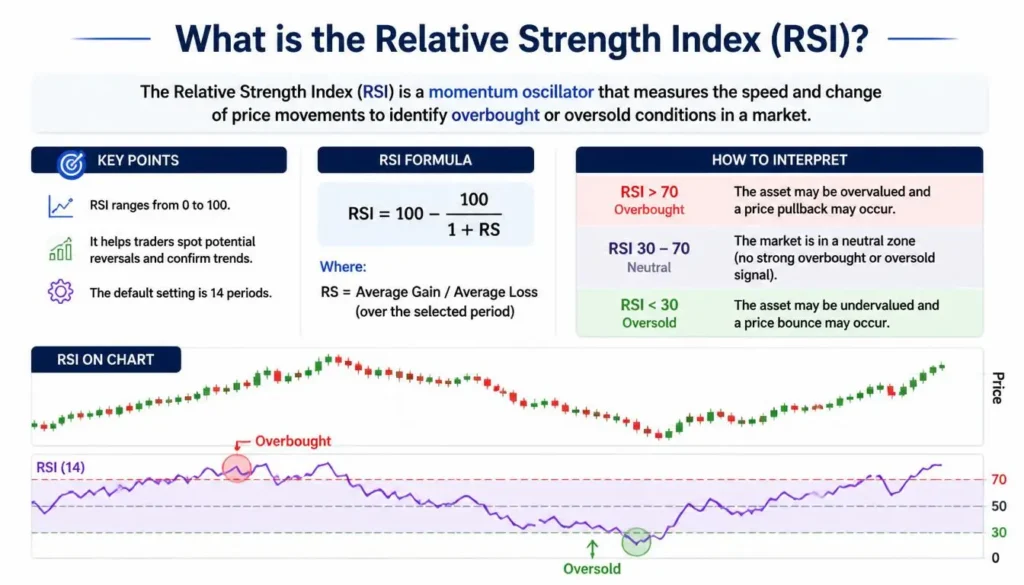
- Overbought Zone (Above 70): Signals that price has moved up rapidly and may undergo a downward pull.
- Oversold Zone (Below 30): Signals that price has dropped quickly and may experience an upward bounce.
The standard lookback period setting for RSI on Quotex charts is 14.
What is Moving Average Convergence Divergence (MACD)?
The MACD tracks market trend direction and shifts in momentum. It consists of three distinct visual elements:
- MACD Line: Calculates short-term momentum using two exponential moving averages.
- Signal Line: Smooths out price changes to provide trade confirmation.
- Histogram: Visualizes the distance between the MACD and Signal lines.
Standard MACD inputs are Fast Period 12, Slow Period 26, and Signal Period 9.
Why Learn How to Use RSI and MACD Together on Quotex?
Single indicators can produce false trading entries when markets consolidate or spike unexpectedly. RSI generates premature reversal signals during strong trending conditions. MACD often lags during rapid price action breakouts.
| Feature | Relative Strength Index (RSI) | MACD Indicator |
| Primary Function | Measures momentum speed | Identifies trend direction |
| Best Used For | Reversals & extreme zones | Crossovers & trend strength |
| Main Weakness | Early signals in strong trends | Slight signal delay |
| Combined Benefit | Pinpoints exact entry timing | Confirms overall market trend |
Using both indicators creates a dual-filter setup. RSI identifies early entry points, while MACD confirms that overall trend momentum supports your direction.
How to Set Up RSI and MACD Indicators on Quotex
Setting up these tools on your Quotex trading panel requires just a few clicks.
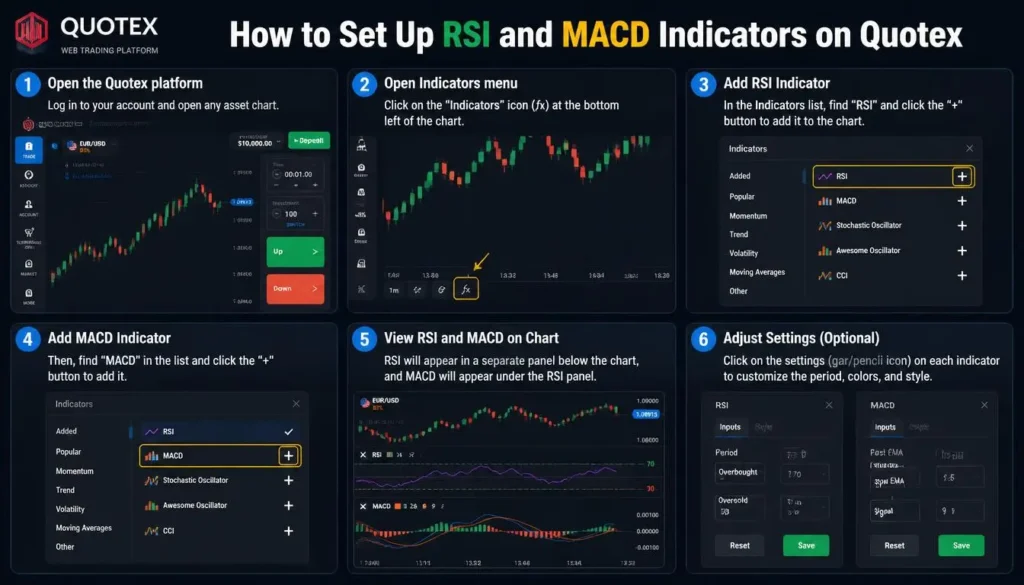
- Log into your Quotex account dashboard.
- Select your desired trading pair, crypto asset, or OTC chart.
- Click the Indicators icon located at the bottom-left corner.
- Select Relative Strength Index (RSI) and keep the period at 14.
- Select MACD from the list and retain the default values (12, 26, 9).
- Set your chart candles to 1-minute or 5-minute timeframes for clean visual signals.
How to Use RSI and MACD Together on Quotex Strategy
1. The High-Probability CALL (UP) Trade Setup
A call option requires synchronized bullish momentum across both tools.
- Condition 1: RSI crosses above 30 from oversold territory or holds steadily above 50.
- Condition 2: The fast MACD line crosses above the Signal line.
- Condition 3: The MACD histogram bars shift from red to green (above zero).
Enter a CALL trade at the open of the next candle when all three conditions align. Set your trade duration to 2 or 3 times your chart timeframe.
2. The High-Probability PUT (DOWN) Trade Setup
A put trade requires aligned bearish signals across both tools.
- Condition 1: RSI crosses below 70 from overbought territory or holds below 50.
- Condition 2: The fast MACD line crosses below the Signal line.
- Condition 3: The MACD histogram bars shift from green to red (below zero).
Enter a PUT trade immediately upon signal confirmation. Match your expiration length to current asset volatility.
Trading Divergence on Quotex with RSI and MACD
Divergence occurs when price action moves in the opposite direction of indicator readings. This setup provides early warning for impending trend reversals.
- Bullish Divergence: Price creates lower lows, but RSI and MACD form higher lows. This pattern signals an upcoming upward reversal.
- Bearish Divergence: Price creates higher highs, but RSI and MACD form lower highs. This pattern signals an upcoming downward correction.
Always wait for the MACD line crossover to confirm the reversal before placing your trade on Quotex.
Essential Risk Management Rules
- Filter High-Impact News: Economic data releases disrupt technical indicators. Pause trading 30 minutes before and after major news announcements.
- Align Expiration Times: Short expirations on higher timeframes cause unnecessary losses. Use 2 to 3-candle expirations consistently.
- Control Position Sizing: Limit trade risk to 1% or 2% of your total account balance per entry.
- Avoid Overtrading OTC Markets: OTC assets can trend sharply without warning. Test your strategy on a demo account before risking real capital.
Frequently Asked Questions (FAQs)
Conclusion
Understanding how to use RSI and MACD together on Quotex provides a structured binary options approach. RSI detects momentum extremes, while MACD confirms directional trend strength. Waiting for both tools to align eliminates market noise and improves setup quality. Test this approach on a Quotex demo account first, enforce strict risk control, and log your trades to achieve consistent performance.